You can subscribe to Reply All on iTunes, Podcast Addict or SoundCloud.
https://gimletmedia.com/show/reply-all/
Wednesday, 2 November 2016

Thursday, 27 October 2016
Quantum Physics in 1990s programming.
Just to prove his point on how an A press is divided into two halves, this guy mainuplates the programming of an age old game to prove the existence of parrell universes, QPUs, hyperspeed walking and much more mind-boggling stuff. I'm not kidding!
By the end of this 20-minute demonstration your mind will be blown.
By the end of this 20-minute demonstration your mind will be blown.
Monday, 12 September 2016

Wednesday, 7 September 2016
I'll be in on Friday for the double
Sorry I've been away... really sick again.
Friday morning we'll go through the chapter questions and some spoonfeeding.
See you then.
fz
Friday morning we'll go through the chapter questions and some spoonfeeding.
See you then.
fz
Sunday, 28 August 2016
John's Choices
John's Choices
For my project, I'll be using a timeline to represent the change over time as well as a column chart and a pie chart to display,
The data I collected is from the United Nations Data website and data.worldbank.org
I will be researching the use of mobile phones in various different country's to see whether or not the phone manufacturing country's are prone to more mobile usage than country's that are consumers of the product's produced.
The data I collected is from the United Nations Data website and data.worldbank.org
I will be researching the use of mobile phones in various different country's to see whether or not the phone manufacturing country's are prone to more mobile usage than country's that are consumers of the product's produced.
Thursday, 25 August 2016
Rahul - Data Visualisation Post 1
For my visualization, I plan to use a pie chart to show how employment affects internet usage over between the years 2006 and 2011. I also plan to use a bubble chart to display the change in internet usage over time vs. the number of people employed and the population of the country.
Weeks 8 & 9 - Presentations & Topic Test for U2O2
Your Presentations are due on Friday 2 September!
For maximum opportunity for feedback on your work please follow the following guide:
- Complete your visualisation by TUESDAY 30 September
- Thursday 1 September you will prepare your presentation
- Friday 2 September: You will present to the class.
REMEMBER!
8.5 Computer Lab is open on monday, Tuesday and Friday lunchtimes for students to work quietly on IT related projects. Make the most of this opportunity!
TOPIC TEST - Friday 9 September!
Wednesday, 24 August 2016
Bunmi's Choices
The data I collected was from investigations conducted from 2012-2013 and is represented as percentages within a Margin of error, as the Census was not conducted by the ABS on 2012 or 2013 I had to take an estimated population for both years from the ABS


From the links I've explored on the blog, I've decided that to make my visualizations simpler and more interactive it would be beneficial to allow the user transition from chart type to the next instead of dumping and compressing them into one space. Additionally, I'll be making use of a limited colour palette and present my visualizations in a minimalist style so that it is easy to read
Response Jackson Cook
Response Jackson Cook
For my
practical I am going to be using both gauge diagram and a timeline to display
my data, as the gauge allows me to thematically display my data comparatively and
the timeline allows me to display the data over time.
In
investigating possible visualization examples, I found that by using scale in
my data allows the viewer to have an insight into what the data actually means
rather than them just being displayed numbers and statistics. I also found that
by having an aspect of interactivity can be used to entice the viewer and make
the presentation more interesting rather than using static diagrams.
Dynamic Visualisations Thursday & Friday 25-26 August
Since the class has made it clear that it prefers that I do NOT use my projector - I have decided to provide all the information here on the blog.
Your homework for Thursday 25 August was to:
MAKE A POST OF YOUR RESPONSES - NAME THE POST "YOUR NAME"
Your work for Friday 26th August:
1. Investigate Visualisation examples here:
YOU WILL HAVE THURSDAY 1 SEPTEMBER IN CLASS TO PLAN YOUR ORAL PRESENTATION TO THE CLASS.
FRIDAY 2 SEPTEMBER YOU WILL PRESENT.
Don't forget to refer to the Example on Simon:
http://simon.humegrammar.vic.edu.au/WebHandlers/LearningAreas/DownloadGeneralDocument.ashx?class=4775&FileName=%5CData%20Visualisation%20Resources%5CExample%20Data%20Visualisation.docx
And the final visualisaton from the three charts on Simon:
http://simon.humegrammar.vic.edu.au/WebHandlers/LearningAreas/DownloadGeneralDocument.ashx?Class=4775&FileName=%5CData%20Visualisation%20Resources%5CExample%20Data%20Visualisation.pptx
Your homework for Thursday 25 August was to:
- finalise your data sets
- decide on your chart types
- investigate the visualisation links on the posts below and name 2 things you thought might inspire your final project.
MAKE A POST OF YOUR RESPONSES - NAME THE POST "YOUR NAME"
Your work for Friday 26th August:
1. Investigate Visualisation examples here:
- http://blog.hubspot.com/marketing/great-data-visualization-examples#sm.000jmqk4mwmgcx410dv20mz9mrwhv
- http://www.webdesignerdepot.com/2009/06/50-great-examples-of-data-visualization/
- PowerPoint to Animate: https://www.youtube.com/watch?v=DKiIWdcI5Yg
- Using Google Charts: https://developers.google.com/chart/interactive/docs/quick_start
- Prezi: https://prezi.com/dashboard/
- A collection of Data Tools online: https://au.pinterest.com/journalismtools/data-analysis-scraping-resources/
- More tools than you can point a visualisation at: http://selection.datavisualization.ch/
YOU WILL HAVE THURSDAY 1 SEPTEMBER IN CLASS TO PLAN YOUR ORAL PRESENTATION TO THE CLASS.
FRIDAY 2 SEPTEMBER YOU WILL PRESENT.
Don't forget to refer to the Example on Simon:
http://simon.humegrammar.vic.edu.au/WebHandlers/LearningAreas/DownloadGeneralDocument.ashx?class=4775&FileName=%5CData%20Visualisation%20Resources%5CExample%20Data%20Visualisation.docx
And the final visualisaton from the three charts on Simon:
http://simon.humegrammar.vic.edu.au/WebHandlers/LearningAreas/DownloadGeneralDocument.ashx?Class=4775&FileName=%5CData%20Visualisation%20Resources%5CExample%20Data%20Visualisation.pptx
Thursday, 18 August 2016
Using Google Charts
Choose a Chart Type:
https://support.google.com/docs/answer/190718?rd=1
Start here: It uses Java Script to make a Pie Chart:
https://developers.google.com/chart/interactive/docs/quick_start
Use Mr Data Converter can convert your excel data to JSON:
https://shancarter.github.io/mr-data-converter/
https://support.google.com/docs/answer/190718?rd=1
Start here: It uses Java Script to make a Pie Chart:
https://developers.google.com/chart/interactive/docs/quick_start
Use Mr Data Converter can convert your excel data to JSON:
https://shancarter.github.io/mr-data-converter/
Online Visualisation Resources.

This is a great link to help you decide HOW to display your data:
https://support.google.com/docs/answer/190718?rd=1
How to use visual features to design your graphic:
https://www.targetprocess.com/articles/visual-encoding/
How to keep your DATA INTEGRITY!
http://guides.library.duke.edu/datavis/topten
Preparting your data in Excel:
http://www.eea.europa.eu/data-and-maps/daviz/learn-more/prepare-data
A collection of Data Tools online:
https://au.pinterest.com/journalismtools/data-analysis-scraping-resources/
More tools than you can point a visualisation at:
http://selection.datavisualization.ch/
For more amazing information about creating Visualisations check out this Blog:
http://www.mulinblog.com/teaching-data-visualization-recommended-readings-and-resources/
Monday, 15 August 2016
Information Problem
You must have decided on an Inverstigation Problem/Question and have your data sets (at least 3) collected by Monday 22 August.
Barry Jones' Knowledge Nation
Barry Jones was the Minister for Science and Technology and he presented this diagram to launch thr program "Knowledge Nation"

But due to the complex nature of the diagram he was ridiculed despite the fact that the program was an important development fo rthe country. The link below is an SMH article reflecting on the bad press as a result.
http://www.smh.com.au/articles/2003/11/24/1069522520166.html

But due to the complex nature of the diagram he was ridiculed despite the fact that the program was an important development fo rthe country. The link below is an SMH article reflecting on the bad press as a result.
http://www.smh.com.au/articles/2003/11/24/1069522520166.html
Wednesday, 10 August 2016
The CORRECT notes.
- Text(String)
- Integer
- Floating point (real) numbers/ i.e Single or Double
- Date/Time (Timestamp)
- Boolean
- Character
- Byte
- Currency
- Etc.
It is important to consider the structure of your data when choosing a data type as pieces could be lost in the exchange or the information may become unusable/invalid.
For instance, converting a time-stamp into an integer means that numbers after the ':' (i.e minutes/seconds) will be erased in favor of the hours.
When storing text, sound or images, it is important to consider it's resolution which is a measure of how much detail is in:
- Images (dots per inch when printed or pixels per inch when onscreen and colour depth)
- Videos(frames per second, frame size and bitrate)
- Audio(sample rate of frequency, bit depth and number of channels)

This is especially of concern when considering methods of compression, Lossy methods of compression are designed to shrink file sizes but result in a loss of detail.
On the other hand Lossless compression can not reduce file sizes as much as Lossy methods but they do not reduce the quality of the file instead they summarise the data.
Digital systemsare comprised of the hardware and software required to support programming and software use.
They are divided into several groups:
- Networks exchange data between groups
- Rules/Protocols that coordinate and standardise communication between devices
- Software which is present in the form of systems, applications or utilities
- Hardware as physical equipment for input, output, storage, processing and communication
- Application architecture, which are principles that provide a framework for resolving recurring errors.
Hardware such as processing hardware and input/output devices are components of digital systems that we can physically interact with
Processing hardware such as CPU and GPU convert data into information while coordinaing all of the other hardware in the system.
There are a few different utitiles that are useful when building programs:
- Editors are text editors that allow a programmer to write or modify code
- Compilers converts programmer's code to machine code so it can be executed
- Linkers are Libraries/Collections of useful modules/small software that can be incorporated into the program
In programming, functional requirements are things that the program is required to do and non-functional requirements detail the process of how the program meets the functional requirements.
In order to carry out these functions, the program must receive compiled language that is converted from the interpreted language that the programmer reads, the programmer may also utilize internal documentation to explain the purpose of certain sections of code.
Internal documentation is an important part of programming along with structure diagrams such as IPO charts, Pseudocode and Object descriptions as they reduce the probability of Syntax and Logic errors from the programmer and invalid code, allowing programmers to focus more on debugging Runtime errors

~Bunmi
Tuesday, 9 August 2016
Sumary Notes Jackson Cook
Summary Notes
Jackson Cook
CPU: Central
Processing Unit – the ‘brain’ of the digital system, as it handles most of the
systems data manipulation.
GPU: Graphic
Processing Unit – very fast High speed processor designed for high speed
graphics through graphics card.
Storage:
Primary
storage: Primary storage is a computer Random Access Memory (RAM), this means
it can only stores data and information whilst the power is on.
Secondary
Storage: Stores data and information when they are not being used. It is most
common for it being stored on the hard disk drive.
Operating
System
Operating
systems such as Macintosh, Windows and Linux is software that controls a
computer’s hardware and runs the users application.
Software
Development tool:
Essential
tools including: Editor, Compiler, Linker, Debugger.
Editor: a
specialised word processor that is used for creating human readable source
code.
IDE Integrated
Development Environment
Creates an
environment for programmers to input code through, and potentially create
interface for.
Example:
Microsoft Visual Studio
Data Types:
Text:
Alphabetical, characters, punctuation – any group of characters that can be
typed.
Integers:
Whole numbers, no fractions
Date/Time:
used to perform complex time and date calculations
Boolean:
True or False, checks whether data is checked or not.
Structure
Diagrams:
IPO Chart:
Used to design programs algorithms and formulas in its basic form of input,
processing and Output
Object
Description: OD is used for the naming and behaviour of objects used in code.
E.g lblInput
Pseudocode:
Fake code, used to organise the structure of the algorithm.
Interface
Mockup: simple layout of interface to show how the data will be inputted and
outputted.
Fundamental
Programming Concepts
Compiled and
Interpreted
Compiled:
programming code that can only be read by computeR
Interpreted:
Programming code that can be read by the programmer
Internal
Documentation: Explanation of the functional and purpose of the source code
Debugging
Logic Error:
Logic errors are made when the programmers structure is incorrect, making the
program innoficiant.
Syntax
Error: Syntax Errors are where the source code is invalid creating invalid
instructions that the program can’t read.
Runtime
Errors: Runtime Errors are caused by factors caused through the hardware.
Monday, 8 August 2016
BIG ANNOUNCEMENT
TECH4K IS SHUTTING DOWN
IT WILL BE REPLACED SOON WITH
RivalReviews
https://www.youtube.com/channel/UC3ClHS2r-LxqWrEVWa8hq1g
Sub to JmkHD
IT WILL BE REPLACED SOON WITH
RivalReviews
https://www.youtube.com/channel/UC3ClHS2r-LxqWrEVWa8hq1g
Sub to JmkHD
Rahul's Notes:
Input --> Processing --> Output
CPU - central processing unit
Eg. Intel core i7-6700K
GPU - graphical processing unit
Eg. Nvidia geforce gtx 1080
RAM - random access memory
Eg. G.Skill Ripjaws 32GB DDR4 4500Mhz RAM
Building Software
- Editor
Eg. Visual Studio Community 2015
- Compiler
Eg. Visual Studio Community 2015
- Linker
Eg. Visual Studio Community 2015
- Debugger
Eg. Visual Studio Community 2015
IDE (Integrated Development Environment)
Eg. Visual Studio Community 2015
1. Form
2. Toolbox
3. Code Window
4. Properties Window
5. Debugger
6. Project manager
PSM (Problem Solving Methodology)

Constraints
- economic
Eg. $$$
- time
Eg. Tick Tock
- technical
Eg. Computer Breaks Down
- social
Eg. You have no friends
- legal
Eg. You're getting sued for being a donkey
- usability
Eg. Idk
Stuffs to do:
- Data dictionary

- Object Table

- Programming Concepts
* Compiled programming language - standalone programs
Eg. Executables
* Interpreted Language - depends on the IDE to output
Eg. HTML
- Modular Programming
Eg. Programming that is modular
- Design Tools
* IPO Chart
* Mockup
* Pseudocode
* Data Dictionary
* Object Table
Variables
Eg. TempVar
- Associated = local
- available to all objects = global
Functions - procedures that return a value
Pseudocode - stuffs you write in scructrd engwish coz u n=eed to no for Thi eggzam
1. Declare Variables
2. Read in Data
3. Calculate
4. Display Output

Data Validation - 3 types
1. Data Type Check - makes sure it is in correct format
Eg. Check for alphanumerical data
2. Range Check - to ensure it is within given range
Eg. Number must be between 68 and 70
3. Existence Check - to make sure it is actually there
Eg. So the user doesn't type " " Internal Documentation
- Something that Callandra forgot to do for one of her really long python programs (Notes within a program that allows the programmed (YOU) or others working on it to know what the code is about.) :D
Testing:
Debugging:
Errors:
- Syntax
- Logic
- Runtime
Desk Checking
Test Data
Alpha Testing
Beta Testing
Formal Testing
Validation
Input --> Processing --> Output
CPU - central processing unit
Eg. Intel core i7-6700K
GPU - graphical processing unit
Eg. Nvidia geforce gtx 1080
RAM - random access memory
Eg. G.Skill Ripjaws 32GB DDR4 4500Mhz RAM
Building Software
- Editor
Eg. Visual Studio Community 2015
- Compiler
Eg. Visual Studio Community 2015
- Linker
Eg. Visual Studio Community 2015
- Debugger
Eg. Visual Studio Community 2015
IDE (Integrated Development Environment)
Eg. Visual Studio Community 2015
1. Form
2. Toolbox
3. Code Window
4. Properties Window
5. Debugger
6. Project manager
PSM (Problem Solving Methodology)

Constraints
- economic
Eg. $$$
- time
Eg. Tick Tock
- technical
Eg. Computer Breaks Down
- social
Eg. You have no friends
- legal
Eg. You're getting sued for being a donkey
- usability
Eg. Idk
Stuffs to do:
- Data dictionary
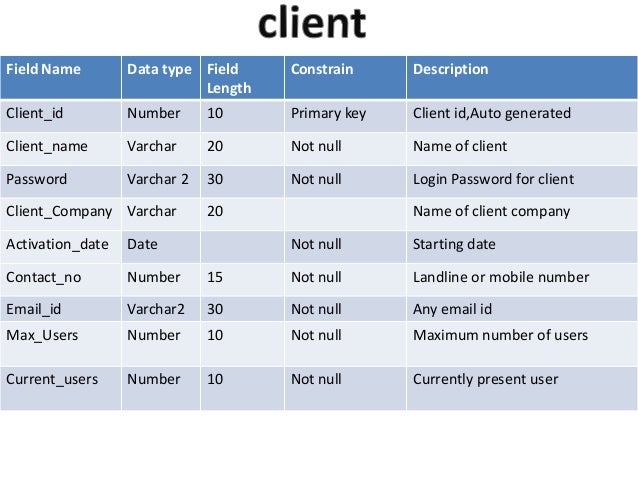
- Object Table

- Programming Concepts
* Compiled programming language - standalone programs
Eg. Executables
* Interpreted Language - depends on the IDE to output
Eg. HTML
- Modular Programming
Eg. Programming that is modular
- Design Tools
* IPO Chart
* Mockup
* Pseudocode
* Data Dictionary
* Object Table
Variables
Eg. TempVar
- Associated = local
- available to all objects = global
Functions - procedures that return a value
Pseudocode - stuffs you write in scructrd engwish coz u n=eed to no for Thi eggzam
1. Declare Variables
2. Read in Data
3. Calculate
4. Display Output

Data Validation - 3 types
1. Data Type Check - makes sure it is in correct format
Eg. Check for alphanumerical data
2. Range Check - to ensure it is within given range
Eg. Number must be between 68 and 70
3. Existence Check - to make sure it is actually there
Eg. So the user doesn't type " " Internal Documentation
- Something that Callandra forgot to do for one of her really long python programs (Notes within a program that allows the programmed (YOU) or others working on it to know what the code is about.) :D
Testing:
Debugging:
Errors:
- Syntax
- Logic
- Runtime
Desk Checking
Test Data
Alpha Testing
Beta Testing
Formal Testing
Validation
Subscribe to:
Posts (Atom)