You can subscribe to Reply All on iTunes, Podcast Addict or SoundCloud.
https://gimletmedia.com/show/reply-all/
Wednesday, 2 November 2016
Thursday, 27 October 2016
Quantum Physics in 1990s programming.
Just to prove his point on how an A press is divided into two halves, this guy mainuplates the programming of an age old game to prove the existence of parrell universes, QPUs, hyperspeed walking and much more mind-boggling stuff. I'm not kidding!
By the end of this 20-minute demonstration your mind will be blown.
By the end of this 20-minute demonstration your mind will be blown.
Monday, 12 September 2016
Wednesday, 7 September 2016
I'll be in on Friday for the double
Sorry I've been away... really sick again.
Friday morning we'll go through the chapter questions and some spoonfeeding.
See you then.
fz
Friday morning we'll go through the chapter questions and some spoonfeeding.
See you then.
fz
Sunday, 28 August 2016
John's Choices
John's Choices
For my project, I'll be using a timeline to represent the change over time as well as a column chart and a pie chart to display,
The data I collected is from the United Nations Data website and data.worldbank.org
I will be researching the use of mobile phones in various different country's to see whether or not the phone manufacturing country's are prone to more mobile usage than country's that are consumers of the product's produced.
Thursday, 25 August 2016
Rahul - Data Visualisation Post 1
For my visualization, I plan to use a pie chart to show how employment affects internet usage over between the years 2006 and 2011. I also plan to use a bubble chart to display the change in internet usage over time vs. the number of people employed and the population of the country.
Weeks 8 & 9 - Presentations & Topic Test for U2O2
Your Presentations are due on Friday 2 September!
For maximum opportunity for feedback on your work please follow the following guide:
- Complete your visualisation by TUESDAY 30 September
- Thursday 1 September you will prepare your presentation
- Friday 2 September: You will present to the class.
REMEMBER!
8.5 Computer Lab is open on monday, Tuesday and Friday lunchtimes for students to work quietly on IT related projects. Make the most of this opportunity!
TOPIC TEST - Friday 9 September!
Wednesday, 24 August 2016
Bunmi's Choices
The data I collected was from investigations conducted from 2012-2013 and is represented as percentages within a Margin of error, as the Census was not conducted by the ABS on 2012 or 2013 I had to take an estimated population for both years from the ABS


From the links I've explored on the blog, I've decided that to make my visualizations simpler and more interactive it would be beneficial to allow the user transition from chart type to the next instead of dumping and compressing them into one space. Additionally, I'll be making use of a limited colour palette and present my visualizations in a minimalist style so that it is easy to read
Response Jackson Cook
Response Jackson Cook
For my
practical I am going to be using both gauge diagram and a timeline to display
my data, as the gauge allows me to thematically display my data comparatively and
the timeline allows me to display the data over time.
In
investigating possible visualization examples, I found that by using scale in
my data allows the viewer to have an insight into what the data actually means
rather than them just being displayed numbers and statistics. I also found that
by having an aspect of interactivity can be used to entice the viewer and make
the presentation more interesting rather than using static diagrams.
Dynamic Visualisations Thursday & Friday 25-26 August
Since the class has made it clear that it prefers that I do NOT use my projector - I have decided to provide all the information here on the blog.
Your homework for Thursday 25 August was to:
MAKE A POST OF YOUR RESPONSES - NAME THE POST "YOUR NAME"
Your work for Friday 26th August:
1. Investigate Visualisation examples here:
YOU WILL HAVE THURSDAY 1 SEPTEMBER IN CLASS TO PLAN YOUR ORAL PRESENTATION TO THE CLASS.
FRIDAY 2 SEPTEMBER YOU WILL PRESENT.
Don't forget to refer to the Example on Simon:
http://simon.humegrammar.vic.edu.au/WebHandlers/LearningAreas/DownloadGeneralDocument.ashx?class=4775&FileName=%5CData%20Visualisation%20Resources%5CExample%20Data%20Visualisation.docx
And the final visualisaton from the three charts on Simon:
http://simon.humegrammar.vic.edu.au/WebHandlers/LearningAreas/DownloadGeneralDocument.ashx?Class=4775&FileName=%5CData%20Visualisation%20Resources%5CExample%20Data%20Visualisation.pptx
Your homework for Thursday 25 August was to:
- finalise your data sets
- decide on your chart types
- investigate the visualisation links on the posts below and name 2 things you thought might inspire your final project.
MAKE A POST OF YOUR RESPONSES - NAME THE POST "YOUR NAME"
Your work for Friday 26th August:
1. Investigate Visualisation examples here:
- http://blog.hubspot.com/marketing/great-data-visualization-examples#sm.000jmqk4mwmgcx410dv20mz9mrwhv
- http://www.webdesignerdepot.com/2009/06/50-great-examples-of-data-visualization/
- PowerPoint to Animate: https://www.youtube.com/watch?v=DKiIWdcI5Yg
- Using Google Charts: https://developers.google.com/chart/interactive/docs/quick_start
- Prezi: https://prezi.com/dashboard/
- A collection of Data Tools online: https://au.pinterest.com/journalismtools/data-analysis-scraping-resources/
- More tools than you can point a visualisation at: http://selection.datavisualization.ch/
YOU WILL HAVE THURSDAY 1 SEPTEMBER IN CLASS TO PLAN YOUR ORAL PRESENTATION TO THE CLASS.
FRIDAY 2 SEPTEMBER YOU WILL PRESENT.
Don't forget to refer to the Example on Simon:
http://simon.humegrammar.vic.edu.au/WebHandlers/LearningAreas/DownloadGeneralDocument.ashx?class=4775&FileName=%5CData%20Visualisation%20Resources%5CExample%20Data%20Visualisation.docx
And the final visualisaton from the three charts on Simon:
http://simon.humegrammar.vic.edu.au/WebHandlers/LearningAreas/DownloadGeneralDocument.ashx?Class=4775&FileName=%5CData%20Visualisation%20Resources%5CExample%20Data%20Visualisation.pptx
Thursday, 18 August 2016
Using Google Charts
Choose a Chart Type:
https://support.google.com/docs/answer/190718?rd=1
Start here: It uses Java Script to make a Pie Chart:
https://developers.google.com/chart/interactive/docs/quick_start
Use Mr Data Converter can convert your excel data to JSON:
https://shancarter.github.io/mr-data-converter/
https://support.google.com/docs/answer/190718?rd=1
Start here: It uses Java Script to make a Pie Chart:
https://developers.google.com/chart/interactive/docs/quick_start
Use Mr Data Converter can convert your excel data to JSON:
https://shancarter.github.io/mr-data-converter/
Online Visualisation Resources.

This is a great link to help you decide HOW to display your data:
https://support.google.com/docs/answer/190718?rd=1
How to use visual features to design your graphic:
https://www.targetprocess.com/articles/visual-encoding/
How to keep your DATA INTEGRITY!
http://guides.library.duke.edu/datavis/topten
Preparting your data in Excel:
http://www.eea.europa.eu/data-and-maps/daviz/learn-more/prepare-data
A collection of Data Tools online:
https://au.pinterest.com/journalismtools/data-analysis-scraping-resources/
More tools than you can point a visualisation at:
http://selection.datavisualization.ch/
For more amazing information about creating Visualisations check out this Blog:
http://www.mulinblog.com/teaching-data-visualization-recommended-readings-and-resources/
Monday, 15 August 2016
Information Problem
You must have decided on an Inverstigation Problem/Question and have your data sets (at least 3) collected by Monday 22 August.
Barry Jones' Knowledge Nation
Barry Jones was the Minister for Science and Technology and he presented this diagram to launch thr program "Knowledge Nation"

But due to the complex nature of the diagram he was ridiculed despite the fact that the program was an important development fo rthe country. The link below is an SMH article reflecting on the bad press as a result.
http://www.smh.com.au/articles/2003/11/24/1069522520166.html

But due to the complex nature of the diagram he was ridiculed despite the fact that the program was an important development fo rthe country. The link below is an SMH article reflecting on the bad press as a result.
http://www.smh.com.au/articles/2003/11/24/1069522520166.html
Wednesday, 10 August 2016
The CORRECT notes.
- Text(String)
- Integer
- Floating point (real) numbers/ i.e Single or Double
- Date/Time (Timestamp)
- Boolean
- Character
- Byte
- Currency
- Etc.
It is important to consider the structure of your data when choosing a data type as pieces could be lost in the exchange or the information may become unusable/invalid.
For instance, converting a time-stamp into an integer means that numbers after the ':' (i.e minutes/seconds) will be erased in favor of the hours.
When storing text, sound or images, it is important to consider it's resolution which is a measure of how much detail is in:
- Images (dots per inch when printed or pixels per inch when onscreen and colour depth)
- Videos(frames per second, frame size and bitrate)
- Audio(sample rate of frequency, bit depth and number of channels)
This is especially of concern when considering methods of compression, Lossy methods of compression are designed to shrink file sizes but result in a loss of detail.
On the other hand Lossless compression can not reduce file sizes as much as Lossy methods but they do not reduce the quality of the file instead they summarise the data.
Digital systemsare comprised of the hardware and software required to support programming and software use.
They are divided into several groups:
- Networks exchange data between groups
- Rules/Protocols that coordinate and standardise communication between devices
- Software which is present in the form of systems, applications or utilities
- Hardware as physical equipment for input, output, storage, processing and communication
- Application architecture, which are principles that provide a framework for resolving recurring errors.
Hardware such as processing hardware and input/output devices are components of digital systems that we can physically interact with
Processing hardware such as CPU and GPU convert data into information while coordinaing all of the other hardware in the system.
There are a few different utitiles that are useful when building programs:
- Editors are text editors that allow a programmer to write or modify code
- Compilers converts programmer's code to machine code so it can be executed
- Linkers are Libraries/Collections of useful modules/small software that can be incorporated into the program
In programming, functional requirements are things that the program is required to do and non-functional requirements detail the process of how the program meets the functional requirements.
In order to carry out these functions, the program must receive compiled language that is converted from the interpreted language that the programmer reads, the programmer may also utilize internal documentation to explain the purpose of certain sections of code.
Internal documentation is an important part of programming along with structure diagrams such as IPO charts, Pseudocode and Object descriptions as they reduce the probability of Syntax and Logic errors from the programmer and invalid code, allowing programmers to focus more on debugging Runtime errors

~Bunmi
Tuesday, 9 August 2016
Sumary Notes Jackson Cook
Summary Notes
Jackson Cook
CPU: Central
Processing Unit – the ‘brain’ of the digital system, as it handles most of the
systems data manipulation.
GPU: Graphic
Processing Unit – very fast High speed processor designed for high speed
graphics through graphics card.
Storage:
Primary
storage: Primary storage is a computer Random Access Memory (RAM), this means
it can only stores data and information whilst the power is on.
Secondary
Storage: Stores data and information when they are not being used. It is most
common for it being stored on the hard disk drive.
Operating
System
Operating
systems such as Macintosh, Windows and Linux is software that controls a
computer’s hardware and runs the users application.
Software
Development tool:
Essential
tools including: Editor, Compiler, Linker, Debugger.
Editor: a
specialised word processor that is used for creating human readable source
code.
IDE Integrated
Development Environment
Creates an
environment for programmers to input code through, and potentially create
interface for.
Example:
Microsoft Visual Studio
Data Types:
Text:
Alphabetical, characters, punctuation – any group of characters that can be
typed.
Integers:
Whole numbers, no fractions
Date/Time:
used to perform complex time and date calculations
Boolean:
True or False, checks whether data is checked or not.
Structure
Diagrams:
IPO Chart:
Used to design programs algorithms and formulas in its basic form of input,
processing and Output
Object
Description: OD is used for the naming and behaviour of objects used in code.
E.g lblInput
Pseudocode:
Fake code, used to organise the structure of the algorithm.
Interface
Mockup: simple layout of interface to show how the data will be inputted and
outputted.
Fundamental
Programming Concepts
Compiled and
Interpreted
Compiled:
programming code that can only be read by computeR
Interpreted:
Programming code that can be read by the programmer
Internal
Documentation: Explanation of the functional and purpose of the source code
Debugging
Logic Error:
Logic errors are made when the programmers structure is incorrect, making the
program innoficiant.
Syntax
Error: Syntax Errors are where the source code is invalid creating invalid
instructions that the program can’t read.
Runtime
Errors: Runtime Errors are caused by factors caused through the hardware.
Monday, 8 August 2016
BIG ANNOUNCEMENT
TECH4K IS SHUTTING DOWN
IT WILL BE REPLACED SOON WITH
RivalReviews
https://www.youtube.com/channel/UC3ClHS2r-LxqWrEVWa8hq1g
Sub to JmkHD
IT WILL BE REPLACED SOON WITH
RivalReviews
https://www.youtube.com/channel/UC3ClHS2r-LxqWrEVWa8hq1g
Sub to JmkHD
Rahul's Notes:
Input --> Processing --> Output
CPU - central processing unit
Eg. Intel core i7-6700K
GPU - graphical processing unit
Eg. Nvidia geforce gtx 1080
RAM - random access memory
Eg. G.Skill Ripjaws 32GB DDR4 4500Mhz RAM
Building Software
- Editor
Eg. Visual Studio Community 2015
- Compiler
Eg. Visual Studio Community 2015
- Linker
Eg. Visual Studio Community 2015
- Debugger
Eg. Visual Studio Community 2015
IDE (Integrated Development Environment)
Eg. Visual Studio Community 2015
1. Form
2. Toolbox
3. Code Window
4. Properties Window
5. Debugger
6. Project manager
PSM (Problem Solving Methodology)

Constraints
- economic
Eg. $$$
- time
Eg. Tick Tock
- technical
Eg. Computer Breaks Down
- social
Eg. You have no friends
- legal
Eg. You're getting sued for being a donkey
- usability
Eg. Idk
Stuffs to do:
- Data dictionary

- Object Table

- Programming Concepts
* Compiled programming language - standalone programs
Eg. Executables
* Interpreted Language - depends on the IDE to output
Eg. HTML
- Modular Programming
Eg. Programming that is modular
- Design Tools
* IPO Chart
* Mockup
* Pseudocode
* Data Dictionary
* Object Table
Variables
Eg. TempVar
- Associated = local
- available to all objects = global
Functions - procedures that return a value
Pseudocode - stuffs you write in scructrd engwish coz u n=eed to no for Thi eggzam
1. Declare Variables
2. Read in Data
3. Calculate
4. Display Output

Data Validation - 3 types
1. Data Type Check - makes sure it is in correct format
Eg. Check for alphanumerical data
2. Range Check - to ensure it is within given range
Eg. Number must be between 68 and 70
3. Existence Check - to make sure it is actually there
Eg. So the user doesn't type " " Internal Documentation
- Something that Callandra forgot to do for one of her really long python programs (Notes within a program that allows the programmed (YOU) or others working on it to know what the code is about.) :D
Testing:
Debugging:
Errors:
- Syntax
- Logic
- Runtime
Desk Checking
Test Data
Alpha Testing
Beta Testing
Formal Testing
Validation
Input --> Processing --> Output
CPU - central processing unit
Eg. Intel core i7-6700K
GPU - graphical processing unit
Eg. Nvidia geforce gtx 1080
RAM - random access memory
Eg. G.Skill Ripjaws 32GB DDR4 4500Mhz RAM
Building Software
- Editor
Eg. Visual Studio Community 2015
- Compiler
Eg. Visual Studio Community 2015
- Linker
Eg. Visual Studio Community 2015
- Debugger
Eg. Visual Studio Community 2015
IDE (Integrated Development Environment)
Eg. Visual Studio Community 2015
1. Form
2. Toolbox
3. Code Window
4. Properties Window
5. Debugger
6. Project manager
PSM (Problem Solving Methodology)

Constraints
- economic
Eg. $$$
- time
Eg. Tick Tock
- technical
Eg. Computer Breaks Down
- social
Eg. You have no friends
- legal
Eg. You're getting sued for being a donkey
- usability
Eg. Idk
Stuffs to do:
- Data dictionary
- Object Table

- Programming Concepts
* Compiled programming language - standalone programs
Eg. Executables
* Interpreted Language - depends on the IDE to output
Eg. HTML
- Modular Programming
Eg. Programming that is modular
- Design Tools
* IPO Chart
* Mockup
* Pseudocode
* Data Dictionary
* Object Table
Variables
Eg. TempVar
- Associated = local
- available to all objects = global
Functions - procedures that return a value
Pseudocode - stuffs you write in scructrd engwish coz u n=eed to no for Thi eggzam
1. Declare Variables
2. Read in Data
3. Calculate
4. Display Output

Data Validation - 3 types
1. Data Type Check - makes sure it is in correct format
Eg. Check for alphanumerical data
2. Range Check - to ensure it is within given range
Eg. Number must be between 68 and 70
3. Existence Check - to make sure it is actually there
Eg. So the user doesn't type " " Internal Documentation
- Something that Callandra forgot to do for one of her really long python programs (Notes within a program that allows the programmed (YOU) or others working on it to know what the code is about.) :D
Testing:
Debugging:
Errors:
- Syntax
- Logic
- Runtime
Desk Checking
Test Data
Alpha Testing
Beta Testing
Formal Testing
Validation
Data Visualisation
Watch these two videos - see how Hans Rosling presents data.
Presentation 1: Myths About the Developing World:
http://www.youtube.com/watch?v=PHhdNEKwN50
Presentation 2: New Insights on Poverty and Life Around the World:
http://www.youtube.com/watch?v=m6bUqlbC-ng
Week 9 notes
Data and Information:
There are two basic types of data
Quantitative Data is measurable and specific and therefore easier to represent in a visual format, It also tends to be numerical
Qualitative Data is generally allows for rich descriptions and represents the participant's feelings or opinions
Quantitative data tends to be less time consuming to collect than qualitative data, however the information that is collected is not in detailed as in Qualitative data due to its numerical natures.
Both types of data are usually collected through techniques such as:
- Questionnaires and Surveys
- Focus Groups
- Interviews
- and Observation
Consequently, they are visually represented through graphs such as Pie or Bar charts or Info-graphics.
Digital Systems:
Digital Systems are divided into three groups:
- Communication Devices
- Communication Software
- Internet Services
Communication devices such as routers allow communication and exchange of data, instructions and information between two devices,
Communication software (such as network operating systems) are programs or apps designed to pass or support the movement/exchange of information.
Internet services are programs or software that support the use of resources found on the internet, for example, internet browsers enable users to view webpages and cloud storage provide a backup location for data that can be accessed by multiple devices.

Approaches to problem solving:
It is often unsuitable to report on data using its raw form so there are various graphic solution used to visually represent data such as:
- Charts
- Flowcharts
- Images
- Hierarchies
- Animations
- Maps
- Infographics
- Etc.
However there are several conventions for graphic solutions that must be followed:
The solution must be functional, which means it is useable across many mediums and easily accessible and it's appearance must follow conventions related to alignment, repetition, contrast and
space
Additionally it must have a clear title, appropriate font, shapes,lines and arrows that divide sections of information as well as colours and contrasting brightness that make the solution pleasant to the eyes/
It is equally as important to include the source of your data as well as a legend so that clients can easily interpret the data and be assured of it's credibility.
.

-Bunmi
Sunday, 7 August 2016
Sunday, 31 July 2016
FRIDAY 5th August 2016
Your Programming SAC is Due Friday 5th August
SO......
SO......
Homework Returns!
Each of you will write a full summary of the notes for this Unit (Started in Week 9 last term).
Your notes and diagrams must include the following:
Data and information
• characteristics of data types and methods of
representing and storing text, sound and images
Digital systems
• functions and
capabilities of key hardware and software components of digital systems
required for processing,
storing and
communicating data and information
Approaches to problem
solving
• functional
requirements of solutions
• methods for creating
algorithms such as identifying the required output, the input needed to produce
the
output, and the
processing steps necessary to achieve the transformation from a design to a
solution
• suitable methods of
representing solution designs such as data dictionaries, data structure
diagrams, object
descriptions and
pseudocode
characteristics of
effective user interfaces, for example useability, accessibility, structure,
visibility, legibility,
consistency,
tolerance, affordance
• techniques for
manipulating data and information
• naming conventions
for files and objects
• testing and debugging techniques, including
construction of test data.
Due Monday 8th August!
Remember you have a TOPIC TEST on Tuesday 30 August
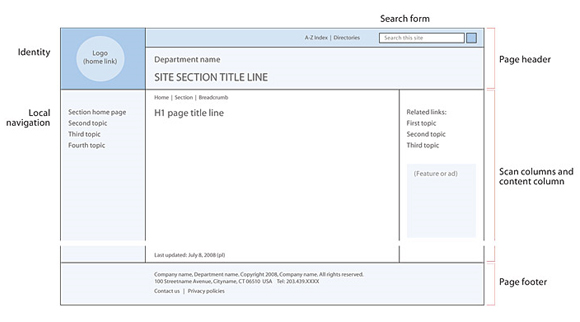
Interface Design tools and Guidelines
Have a look at the guidelines for User Interface design at these two slinks:
- User Interface Online Resources:
- http://www.usability.gov/tags/user-interface-design/index.html
- User interface design
- Usability.gov
- www.usability.gov
Check out this cool tool for designing Interfaces:
- User interface software tools
- Mock Flow
- www.mockflow.com
Friday, 29 July 2016


Sunday, 17 July 2016
Your Progress through the VB Tutorials
You should be at least halfway through the VB Exercises.
Your task now is to use the VB Activities PowerPoint found here on Simon.
There are TWO PowerPoint Documents - Visual Basic PART A and Visual Basic PART B.
PART A - Covers Lessons 1 - 13
PART B - Covers Lessons 14 - 25
Enjoy!
Your task now is to use the VB Activities PowerPoint found here on Simon.
There are TWO PowerPoint Documents - Visual Basic PART A and Visual Basic PART B.
PART A - Covers Lessons 1 - 13
PART B - Covers Lessons 14 - 25
Enjoy!
Sunday, 10 July 2016
Unit 2
Welcome Back - Hope you did your homework.... here's a reminder of what you were supposed to have completed:
1. Be
jealous of Ms Farrell on the beach in Bali and perhaps follow her adventures on
her blog.
2. Read
Chapter 6
3. Complete
all Test Your Knowledge Questions on Page 259
4. Create
the Guessing Game on Page 260
5. Complete
the 25 vbtutor.org lessons.
d See you Tuesday!
Tuesday, 14 June 2016
Robustness VS Tolerance
Tolerance is the capacity of software to forgive user
errors, such as when they accidentally click on a link or make other typical
errors. A tolerant interface will allow the user to cancel, go back, or undo an
action.
Robustness is the capacity of a system to cope
with stressful or unusual runtime environmental problems, such as
running low on memory or disk space, equipment faults (e.g. printer not found),
dumb/invalid/unexpected user inputs, high usage levels, and uncommon but
feasible events that would break lesser software - for example, coping with a
user whose street address is just "11 Broadway" with no
"Rd", "St" or "Av" field.
Wednesday, 8 June 2016
Visual Studio & VB Tutorials
VISUAL STUDIO COMMUNITY
1. At School
You will need to use an account: Choose PERSONAL
- USERID: itclass@humegrammar.vic.edu.au
- Password: Hume123#
2. At Home
- https://www.visualstudio.com/
- Select the Green button "Download Community 2015"
Video Tutorials to get you started:
- Simple Visual Basic Application (VS2015)
- https://www.youtube.com/watch?v=njyrhf-wd70
- Absolute Beginners video (many tutorials) Visual Basic (2013)
- https://www.youtube.com/watch?v=dJgKGwOjYLs
VISUAL BASIC TUTORIALS
You should be familiar with vbtutor.net from last year. Well, they have a lovely new website and nice new tutorials for VB2015.
- http://www.vbtutor.net/index.php/visual-basic-2015-tutorial/
- Complete Lessons 1 - 25
- Lesson 10 is very important!
Sunday, 5 June 2016
Unit 2 Outcome 1 Programming
Here are some further reading on Hardware and Software
CPU types - RISC (Reduced instruction set computer) and CISC(Complex instruction set computer) are the types of instruction set for the processors.
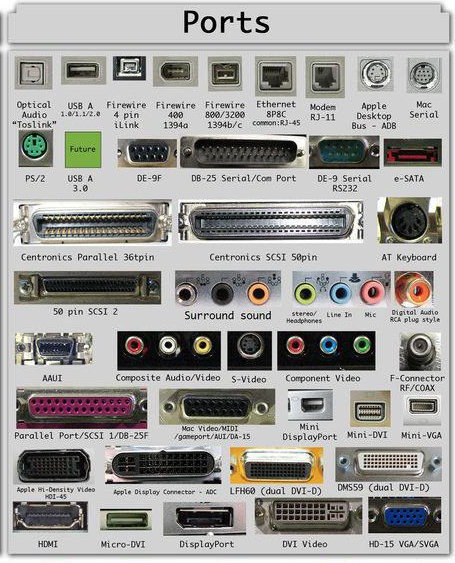
Types of ports:
http://eleele.persiangig.com/ELEELE/89-Files/Ports.jpg
CPU types - RISC (Reduced instruction set computer) and CISC(Complex instruction set computer) are the types of instruction set for the processors.
- https://en.wikipedia.org/wiki/Reduced_instruction_set_computing
- http://cs.stanford.edu/people/eroberts/courses/soco/projects/risc/risccisc/
How RAM Works: http://computer.howstuffworks.com/ram.htm
Types of ports:
http://eleele.persiangig.com/ELEELE/89-Files/Ports.jpg
Tuesday, 31 May 2016
Tuesday, 24 May 2016
Usability
Check out this site that presents the elements of good web design and interface design:
http://www.usability.gov/tags/user-interface-design/index.html
http://www.usability.gov/tags/user-interface-design/index.html
Thursday, 19 May 2016
Design Choices
Our website has working links that lead to every page no matter where the user is, it will also be able to sense the type of device that the is be used to view the website and scale and move elements of the page to better suit specific devices.
Smartphones users will be able to navigate through pages by tapping the links in the menu, we will also include links to the the sub-topics within the relevant pages. Each link is labelled in a way that clearly describes the contents of the page.
We have decided not to use symbolic icons in place of text to reinforce the simplicity of our website, as such, we have made sure that each page is identical in colour and structure to ensure that users are not confused.
The only information contained in the website are facts and research that inform users of our reliance on technology and relevant issues.Following the 'F' writing convention ensures that users will not have trouble finding our information or where they should start reading.
Our limited colour palette and font gives our website a sense of professionalism and makes users more likely to consider our information rather than ignore it. The use of white space ensures that the contents of each page is not cluttered and illegible.
We decided on a landscape orientation as a portrait page would stretch the information down the page, making users have to scroll down for long periods of time. We made sure that the content on the homepage was minimal or brief in comparison to the available space on the page to ensure that we could add extra content or media later on to catch the user's eye.
~Bunmi, Rahaul, Jackson
Wednesday, 18 May 2016
Salting
Check out this link and find out more about "Salting":
http://www.msn.com/en-au/money/company-news/millions-of-linkedin-ids-for-sale/ar-BBtcVl9
http://www.msn.com/en-au/money/company-news/millions-of-linkedin-ids-for-sale/ar-BBtcVl9
Short Report
We decided to include the research we conducted as well as some our primary data to better inform users about technology reliance and illustrate the presence of technology in our lives. Some of the primary and secondary data was removed as it was descriptive rather than informative. For example, we did not include what the survey participants primarily used technology for.
We’ve arranged the menu by topic and utilized simple drop down sub-menus to make it easier for users to choose whether they want to learn about a specific part of technology reliance or it’s issues, such as the stakeholders in technology reliance or the impacts of our reliance on technology and navigate back to the homepage swiftly at anytime.
Our website has an about us page which will have contact details so that users can email any questions or suggestions they might have to us, which will provide room for more information to be included and enables us to identify when to update our website if it turns out the data is inaccurate or outdated.
Due to the fact that the information takes up small portions of the screen, additional information can be added without the need to scroll down for long periods of time. In the event that we have an excess of information on one page, it can be broken down into separate topics on the menu bar or the fill down sub menus as additional pages.
~Bunmi, Rahul, Jackson
Tuesday, 17 May 2016
PART A: DESIGN
Both groups need to return to the decisions you made in PART A: Design and Justify your choices.
READ pp181 - 195
One poster per group - Post your Design layout & Site Map and write a justification for your decisions including all the features listed below:
Functionality:
Accesssibility
READ pp181 - 195
One poster per group - Post your Design layout & Site Map and write a justification for your decisions including all the features listed below:
Functionality:
- Usability
- Robustness
- Flexibility
- Scale ability
- Ease of Use
Accesssibility
- Error tolerance
- Navigation
- Meaning
- Comprehension
- Consistency
- Appropriateness and Relevance
Appearance
- Alignment
- repetition
- Font Selection
- Contrast
- Colour
- Space
- Conventions
- Proportions
- Orientation
Wednesday, 11 May 2016


Tuesday, 10 May 2016
The other Issue
Environmental Damage from E-Waste
Australians are early adopters of technology: Deloite
What is e-waste? http://www.huffingtonpost.com/mary-kay/the-dark-side-of-the-digi_b_7140120.html
The cost of recycling: http://www.thesolutionsjournal.com/node/237222
The global time bomb, e-waste is toxic! http://www.abc.net.au/science/articles/2013/09/16/3849737.htm
Monday, 9 May 2016
Visualization Tools
Oh look..... a whole website about visualisation tools.
http://www.enchantedlearning.com/graphicorganizers/pmi/

http://www.enchantedlearning.com/graphicorganizers/pmi/
The Other Issue
Environmental Hazardous Waste.
http://www.wired.com/2016/05/location-trackers-reveal-e-junk-really-ends/
http://www.wired.com/2016/05/location-trackers-reveal-e-junk-really-ends/
Chapter 4# Q's
CHAPTER 4# Questions
Information
systems in action
Q2)List the four components of an information system: Data, Hardware, Networks, Software.
Q4)Explain what the term ‘digital system’ means: Digital computer, a
computer handling information represented by discrete values. Digital electronics,
electronic circuits representing signals by discrete bands of analog levels,
rather than by a continuous range.
Q6)Identify a situation where downloading a file may be legal: It would be legal to download Free and open source software.
It is software that is released under licences that ensure that end users
always have the freedom to run the program, for any purpose, the freedom to
study how the program works, and adapt it to their needs, the freedom to
redistribute copies of the program to others
Q8)Explain how the concepts of copyright and intellectual
property are related: Both are legal rights for a business/corp to apply use and distribution
of its product.
Q10)Explain how peer-to-peer(P2P) file sharing works: The file-transfer load
is distributed between the computers exchanging files, but file searches and
transfers from your computer to others can cause bottlenecks.
Q12)Outline how artists may be disadvantaged by illegal
downloading and streaming: Illegal
downloading of an artist's work, be it an author or a musician, deprives that
artist of the residuals connect to the sale of his/her production.
Q14)Disscuss three ways that social media may become
problematic for sportspeople: Foul language, Entertainment from trolling and morale
issues arise.
Q16)Explain the purpose of a hashtag: A hashtag is
a type of label or metadata
tag used on social network and microblogging services which makes it easier for users to find messages with a
specific theme or content. Users create and use hashtags by placing the hash
character (or pound sign)
# in front of a word or unspaced phrase, either in the main text of a
message or at the end. Searching for that hashtag will then present each
message that has been tagged with it.
Q18) Disscuss some of the negatives around the introduction
of new technology in the agricultural sector: The current work force in the
agriculture industry may have poor skill and require qualifications to operate
newer technology. Being in an isolated position means it is harder to find the
skilled workers.
Q20)Explain why e-commerce has become so popular: Shopping online makes it easy to
browse a full selection of products easily without having to sort through all
of the items commonly found in a brick and mortar store. eCommerce stores have
made it seamless to find exactly what you are looking for and complete the
transaction quickly and efficiently.
Q22)Explain what ‘Phishing’ means: Phishing is the
attempt to acquire sensitive information such as usernames, passwords, and
credit card details (and sometimes, indirectly, money), often for malicious
reasons, by masquerading as a trustworthy entity in an electronic communication.
Q24)Discuss three precautions people can take to reduce their
chances of both card and identity theft:
• Clear your logins and passwords. This is especially important if
you’ve been working on a public computer. Change logins and passwords monthly.
• Pay for online purchases
with your credit card, which has better guarantees under federal law than your
online payment services or your debit card.
• Be alert for phishing, a
trick in which spam or pop-ups mimic legitimate banks or businesses to obtain
your personal information, which they use to access your accounts. Always
verify that you’re on a familiar Web site with security controls before
entering personal data.
Q26)Outline two issues arising from the use of an Electronic
Health Record(HER):
-There are
chances of health records being sent to a wrong location.
-Network
failure can delay access to any records.
Expressing
opinions
Q28) Discuss why
social media sites are a popular outlet to express opinions about information
systems:
Q30) Describe the advantages of written comments over a rating
system for opinions: Written comments give a more detailed and in-depth review of the ‘persons’
opinion, it also gives a better idea of what the person is think. A rating system could mean anything, or
poorly display the users full opinion.
Methods and
techniques to acquire data and information
Q32) Explain the difference between primary and secondary
data sources: The difference between primary and second research collection is that primary research data collection
involves conducting research oneself, or using the data for
the purpose it was intended for. Secondary research data, on the other hand, was collected by a third
party or for some other purpose.
Q34)Discuss when a survey would be preferable to an interview
when collecting data: Surveys can be more in quantity and provide more perspectives from
people.
Q36)Explain how qualitative data differs from quantitative
data: Qualitative data collection is a method in which the
characteristics, attributes, properties, qualities, etc. of a phenomenon or
thing is described. It is the description of data in a language rather than in
numbers. This method does not measure the characteristics but describes them.
Q38)Explain how a histogram can be used to process qualitative data: A histogram is a graphical representation of the distribution of numerical data. It is an estimate of the probability distribution of a continuous variable (quantitative variable) and was first introduced by Karl Pearson.
Q38)Explain how a histogram can be used to process qualitative data: A histogram is a graphical representation of the distribution of numerical data. It is an estimate of the probability distribution of a continuous variable (quantitative variable) and was first introduced by Karl Pearson.
Data
integrity
Q40)List the three characteristics of quality data:
·
Degree of excellence exhibited by the data in relation to the
portrayal of the actual scenario.
·
The state of completeness, validity, consistency, timeliness and
accuracy that makes data appropriate for a specific use.
·
The totality of features and characteristics of data that bears
on its ability to satisfy a given purpose; the sum of the degrees of excellence
for factors related to data.
Storing
shared files
Q42)List three advantages of cloud computing: Flexibility, Document control and Security.
Mobile devices
and web design
Q44)Explain why websites used in mobile devices need to be
designed to differently to websites used for notebooks or desktops:
Q46)List three ways that data may be entered into a mobile
device:
** Unanswered Questions and untidy layout will be edited
shortly.
Worst Website 1# Jackson
Worst Website
So yeah, here is literally the worst website,
It ticked all of the boxes so much that I have only just realized what its purpose of a website it is. So yeah http://www.theworldsworstwebsiteever.com/


Subscribe to:
Posts (Atom)